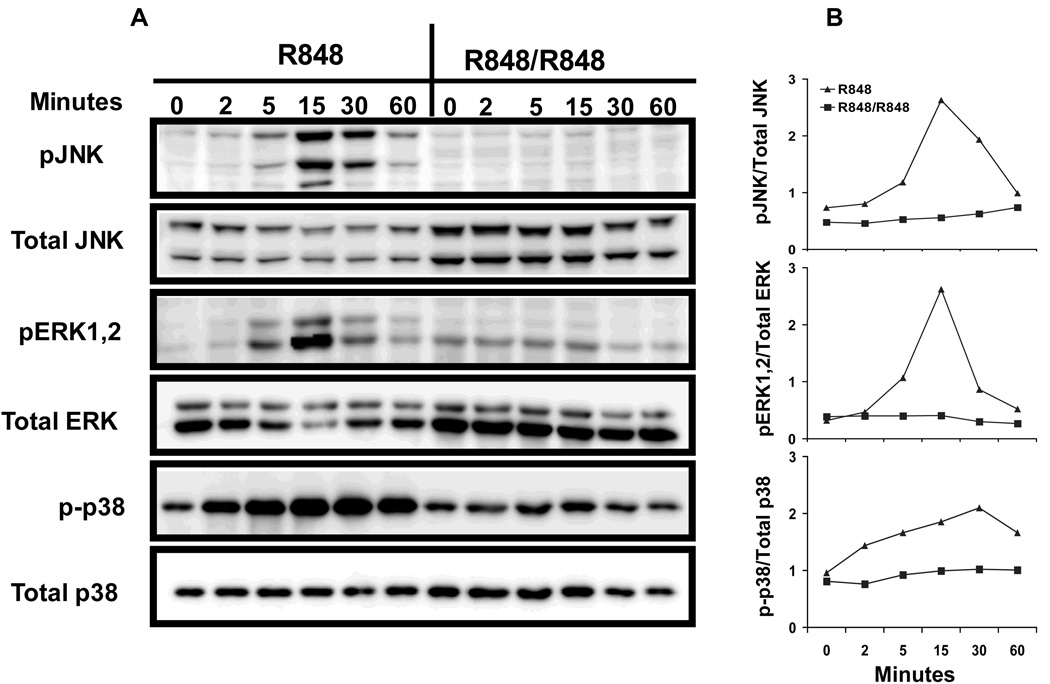
Figure 3. MAP kinase activation in TLR7 tolerant B cells.
A. Mouse high density resting B cells stimulated with R848 (1µg/ml) for 24h were washed and restimulated with R848 (1µg/ml) for indicated time points. Control B cells were incubated at 37°C for 1h in culture medium and then stimulated with R848 for times indicated. Cells were lysed and whole cell extracts were subjected to Western blot analysis as described in Materials and Methods for pJNK, pERK1,2 and p-p38. Blots were stripped and reprobed for total JNK, ERK1,2 and p38. B. Quantitation of MAP kinase activation. The amount of phospho and total JNK, ERK1,2 and p38 in each lane was quantified using ImageGauge software. The amount of pJNK, pERK1,2 and p-p38 in each lane was normalized to the intensity of corresponding total JNK, ERK1,2 or p38 bands and the results are presented graphically. Results are representative of 3 independent experiments.

