
Figure 6.
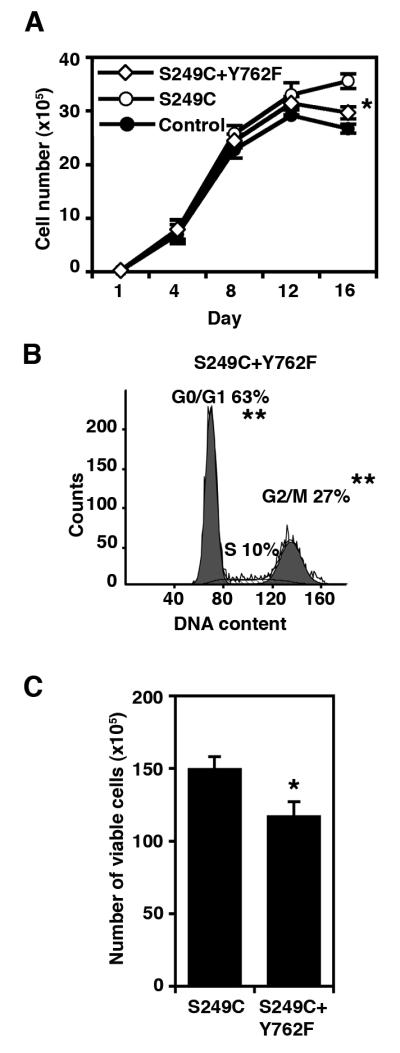
Contribution of PLCγ1 phosphorylation to saturation density in TERT-NHUC. (a) Growth curves showing saturation density achieved by cells expressing S249C+Y762F FGFR3, compared with cells expressing S249C FGFR3 and control cells. (b) Flow cytometric analysis of cell cycle profiles of confluent cells (day 12) expressing S249C+Y762F FGFR3. (c) Representative experiment showing the number of viable cells at confluence (day 12) in cultures expressing S249C+Y762F FGFR3 compared with cells expressing S249C FGFR3. Significant differences to S249C cells are indicated as ‘*’ (p<0.05) or ‘**’ (p<0.01)