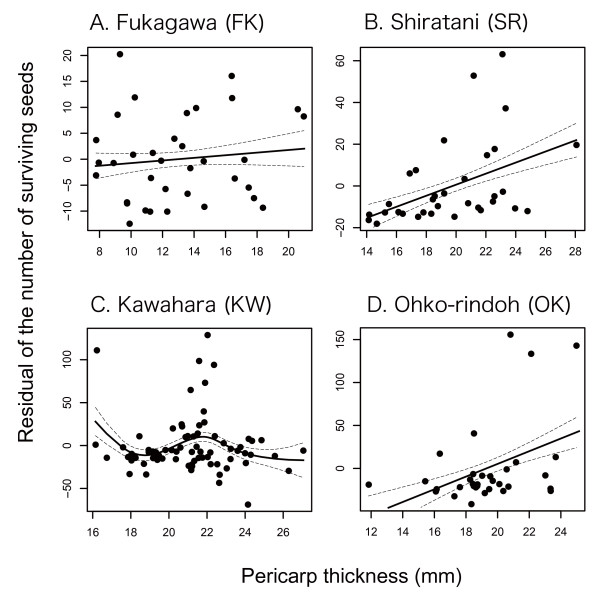
Figure 6.
Geographic selection mosaic for camellia pericarp thickness. The number of surviving seeds was regressed on pericarp thickness in each population (see Table 4 and Additional file 2). Because the effect of individual tree size, as evaluated by diameter at breast height, was controlled in the regression, the residual of the number of surviving seeds is shown in this figure. Solid lines represent prediction curves by cubic splines with ± SE.

