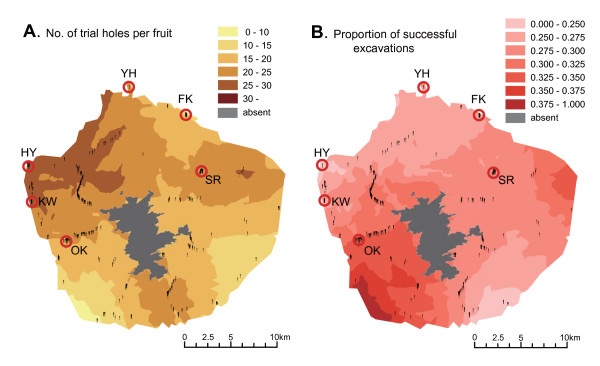
Figure 7.
Geostatistical analyses of weevil attacks on camellia fruits within Yakushima Island. (A) Geographic variation in the number of trial holes per camellia fruit made by camellia weevils. Areas where the Japanese camellia is absent (> 1,400 m) are represented by grey. Vertical bars represent sampling locations. (B) The geographic variation in the proportion of successful excavations of camellia pericarps by camellia weevils.

