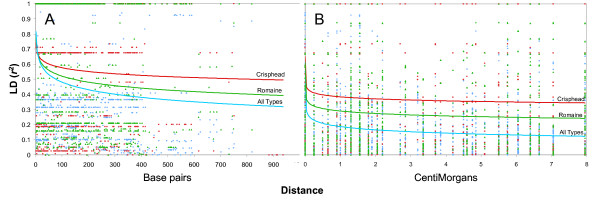
Figure 3.
Decay of linkage disequilibrium (r2) as a function of distance between two SNPs. Pooled data from nine markers in the Tvr1 region were used to estimate the (A) intra-locus and (B) inter-locus linkage disequilibrium. Distances for the intra-locus LD are in base-pairs (bp), while those for inter-locus LD are in centimorgans (cM). The lines indicate logarithmic curves fitted to the data from a set of 68 accessions representing either all horticultural types, or data from crisphead or romaine types only.

