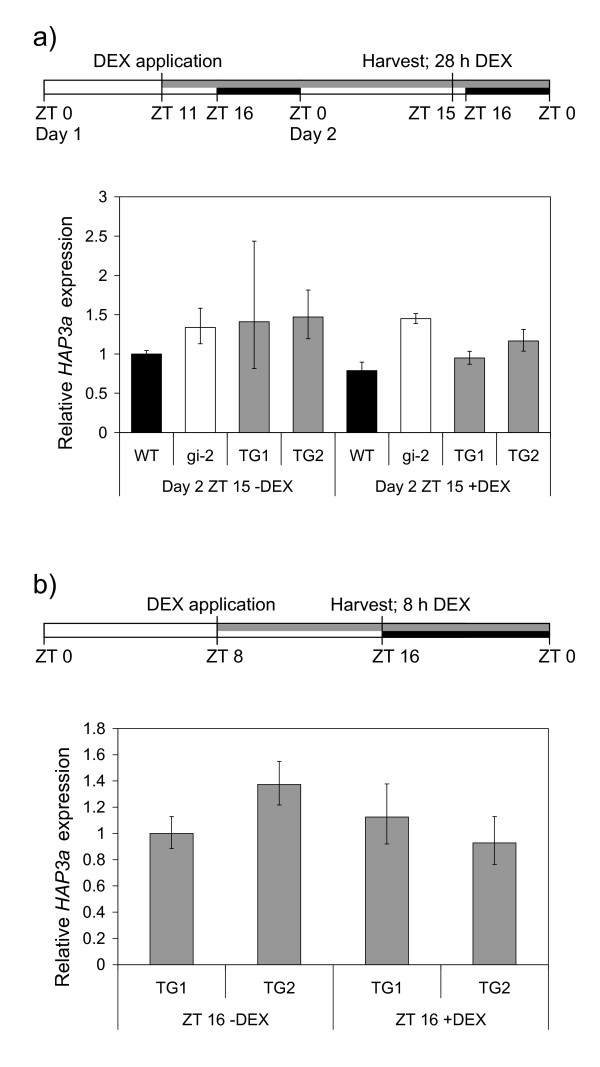
Figure 5.
Analysis of transcript abundance of the putative flowering-time gene HAP3A in transgenic (TG) and control Arabidopsis plants in long day conditions after DEX application. a) Relative transcript accumulation is shown at ZT15 on Day 2, 28 h after DEX was applied to 15 day-old plants growing on agar plates in LD. b) Relative transcript accumulation in TG plants is shown at ZT 16, 8 h after DEX was sprayed onto 15 day-old plants growing in hydroponic media in LD. Plants were treated with DEX (+DEX) or control solutions (-DEX). Transcript abundance was quantified using qRT-PCR and expression levels were normalised to At2g32170. The data is presented as mean +/- SD for 3 qRT-PCR replicates. The black bars on the harvest scheme indicate night, the open bars indicate day and the grey bar indicates the length of treatment with DEX or control solutions, ZT0 is lights on.

