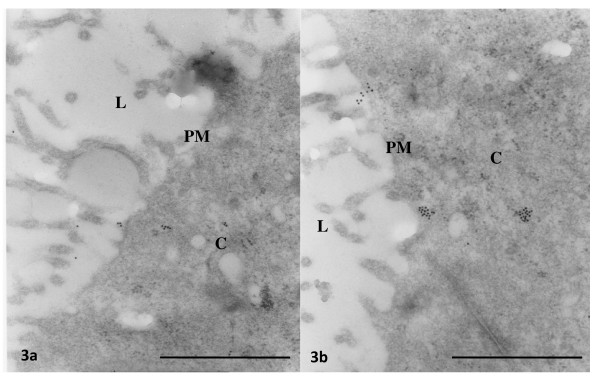
Figure 3.
Representative photomicrographs at low magnification of oviductal epithelial cells processed by immunoelectron microscopy with gold labelled-antibodies of 40 nm for ESR1 (a) or ESR2 (b). Arrows denotes ESR1-or ESR2 reacting gold particles in the epithelial cells. Note scarce unspecific background laleling. Bar: 0.5 μm. PM = plasma membrane, C = cytoplasm, L = lumen.

