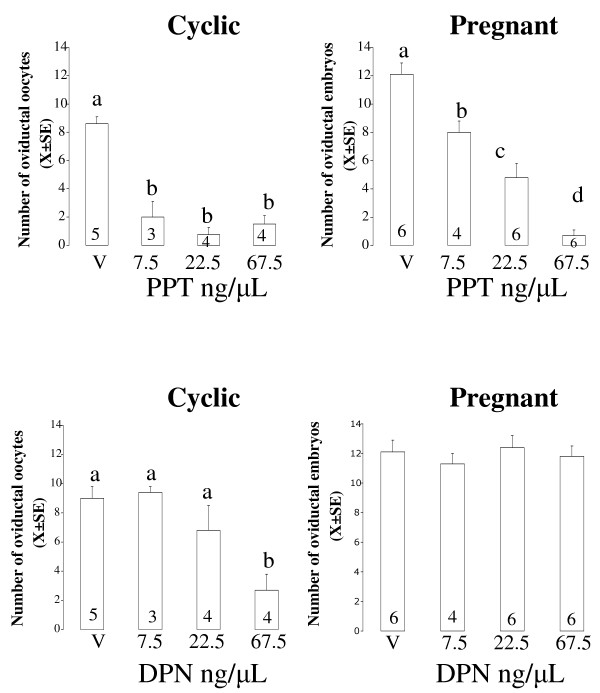
Figure 7.
Mean number of eggs (X ± SE) recovered from rat oviducts on day 2 of the cycle or pregnancy, 24 h after intrabursal treatment with different doses of the selective agonists of ESR1, PPT or ESR2, DPN. Figures inside the bars indicate the number of animals used. Means with different letters are significantly different from each other within each graph, a ≠ b ≠ c (P < 0.05).

