
Figure 4.
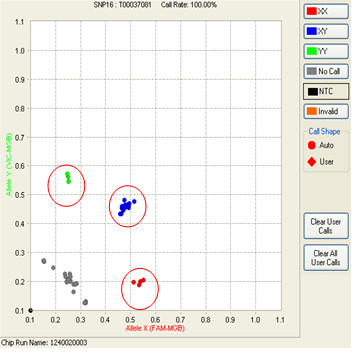
Comparison of genotyping calls from the same sets of 15 samples that were either genotyped directly, or after the STA step. The circled dots are data points generated from the STA samples.
Official websites use .gov
A
.gov website belongs to an official
government organization in the United States.
Secure .gov websites use HTTPS
A lock (
) or https:// means you've safely
connected to the .gov website. Share sensitive
information only on official, secure websites.
Comparison of genotyping calls from the same sets of 15 samples that were either genotyped directly, or after the STA step. The circled dots are data points generated from the STA samples.