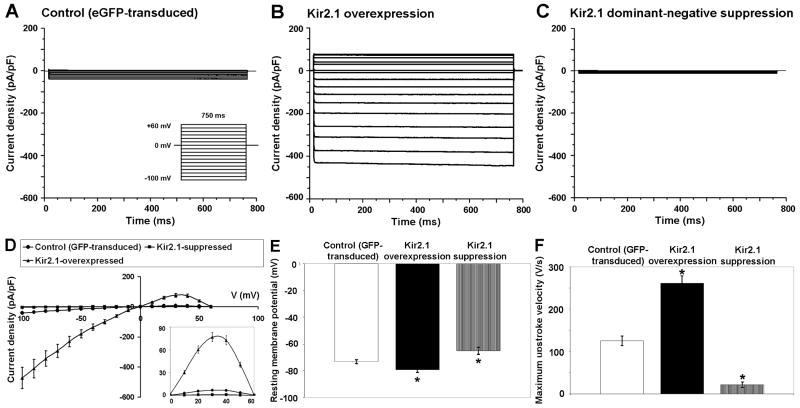
Figure 2.
Altered single-cell electrophysiological properties of Kir2.1-transduced NRVMs. Average IK1 density for eGFP-transduced (A), Kir2.1-transduced (B), and Kir2.1AAA-transduced NRVMs (C) determined with square, 800 ms long, test pulses from -100 to +60 mV, applied from a holding potential of 0 mV, at 10 mV increments. (D) I-V relationship for each group determined with square test pulses from -100 to +60 mV with the magnified outward component of IK1 shown in the bottom right corner. RMPs (E) and maximum upstroke velocity of APs (F) recorded for each group.

