Figure 6.
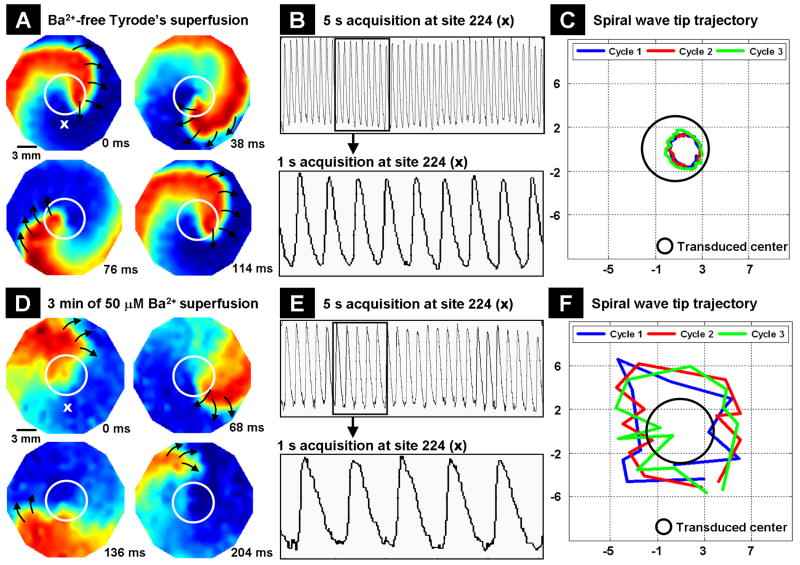
Dynamics of induced reentrant spiral waves in 21 mm diameter monolayers with a central island of Kir2.1 overexpression. The mapping region is 17 mm in diameter. (A) The induced spiral wave anchored to region of Kir2.1 overexpression (indicated by white circles) and was stable. Black arrows represent the direction of wavefront propagation. (B) The optical recording obtained over a 5 sec (upper panel) interval at site 224 is magnified to show the frequency of the reentry (bottom panel). (C) Trajectory of the tip of an induced spiral wave is shown over three successive cycles (blue, red and green traces) with respect to the region of Kir2.1 overexpression (black circle). The X- and Y- axes are position on monolayers in mm. (D) Unstable spiral wave after 3 min of Ba2+ superfusion. (E) Five sec and 1 sec acquisitions of the spiral wave shown in (D) from site 224. (F) Meandering pattern of the spiral wave tip trajectory after 3 min of Ba2+ superfusion.

