
Figure 2. Conditioned media from HGF-secreting mammary fibroblasts stimulates invasive outgrowths of MCF10.DCIS cells, their invasion through rBM and degradation of DQ-collagen IV.
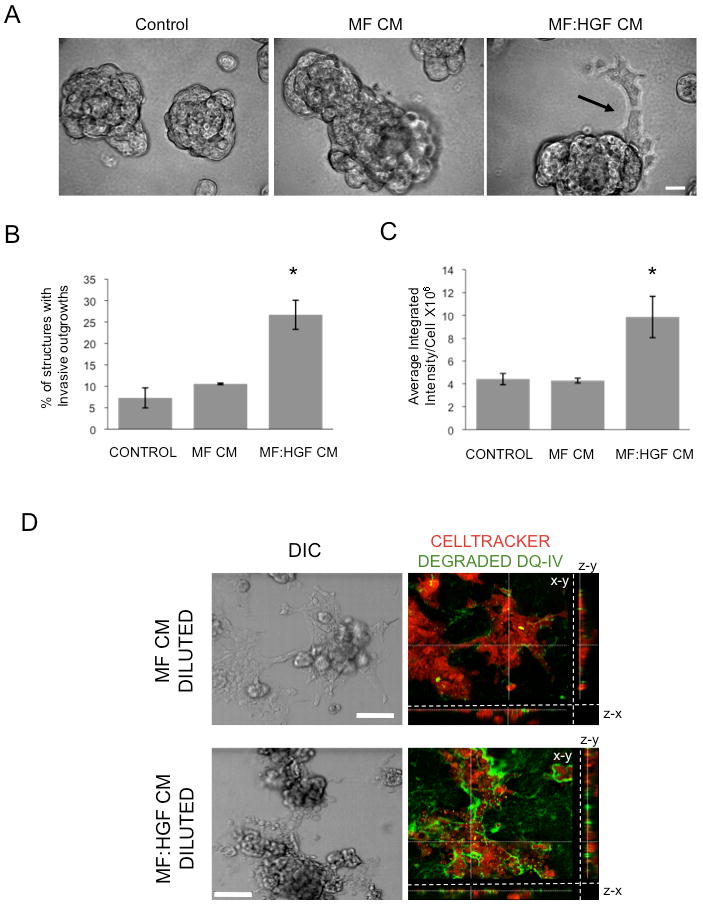
A, B and C: MCF10.DCIS cells were grown in 3D rBM culture in the absence of fibroblast-conditioned media (Control) or the presence of media conditioned by mammary fibroblasts (MF CM) or HGF-secreting mammary fibroblasts (MF:HGF CM). A, MF:HGF CM stimulates invasive outgrowths (arrow) of cells from 3D structures; bar, 20 μm. B, Images were scored for the percentage of structures with invasive outgrowths. Graphs represent data pooled from 14 fields of view from each of three separate experiments and are presented as mean percentage of 3D structures with invasive outgrowths ± SD. *, p<0.02, significant increase as compared to control and MF CM values (Student's t-test). C, MCF10.DCIS cells were grown in 3D rBM culture containing DQ-collagen IV without (Control) or with MF CM or MF:HGF CM for 4 days before imaging. Graphs represent average integrated fluorescence intensity per nuclei in relative fluorescence units (RFU) and are pooled from three separate experiments and presented as mean ± SEM (n=18). *, p<0.02, significant increase as compared to control and MF CM values (Student's t-test). D, MCF10.DCIS cells were grown in 3D rBM overlay culture on coverslips for 4 days, labeled with CellTracker Orange and the coverslips inverted onto glass bottom dishes coated with rBM, containing DQ-collagen IV, that had been diluted with either MF CM or MF:HGF CM. Cultures were imaged live following 18 hours. Representative DIC images and corresponding merged images of DIC, CellTracker Orange (red) and degraded DQ-collagen IV (green) channels are shown; bar, 100 μm. Each merged image represents a focal plane observed in x/y, y/z and x/z axes.