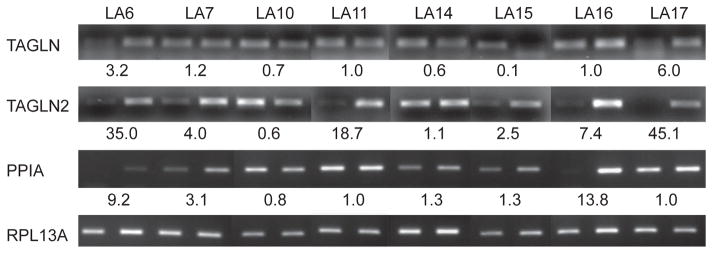
Figure 2. Quantitative RT-PCR analysis of TAGLN, TAGLN2, and PPIA mRNA abundance.
mRNA abundance of TAGLN, TAGLN2, and PPIA was compared between matched paired normal and lung adenocarcinoma tissues samples. The normalized expression ratios (cancer:normal) are shown relative to the internal control gene RPL13A (ribosomal protein L13A) transcript.

