
Figure 2.
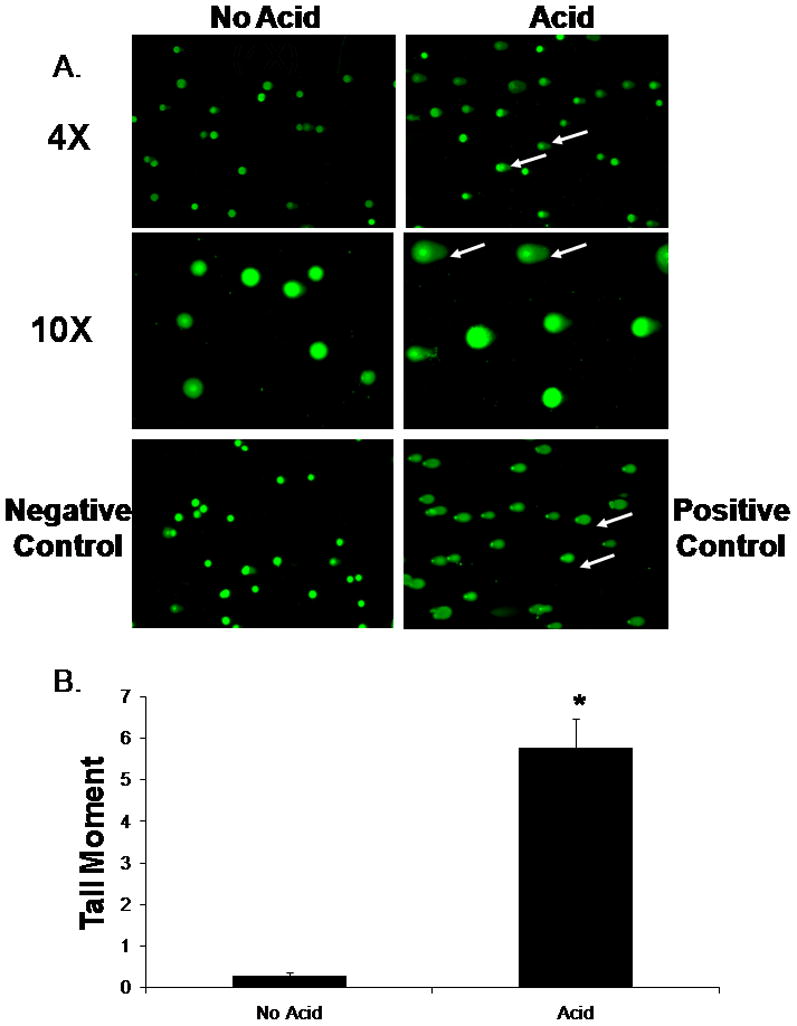
(A.) Representative experiment showing the results of the CometAssay performed at alkaline conditions in BAR-T cells following a 10-minute acid exposure at low magnification (4X) and high magnification (10X). Note the presence of comet “tails” indicating DNA damage in the acid-exposed cells (arrows). BAR-T cells treated with H2O2 served as a positive control. (B.) Bar graphs depict the comet tail moment values + SEM from a minimum of 50 individual cells. (*, p<0.0001 compared with non-acid treated controls)