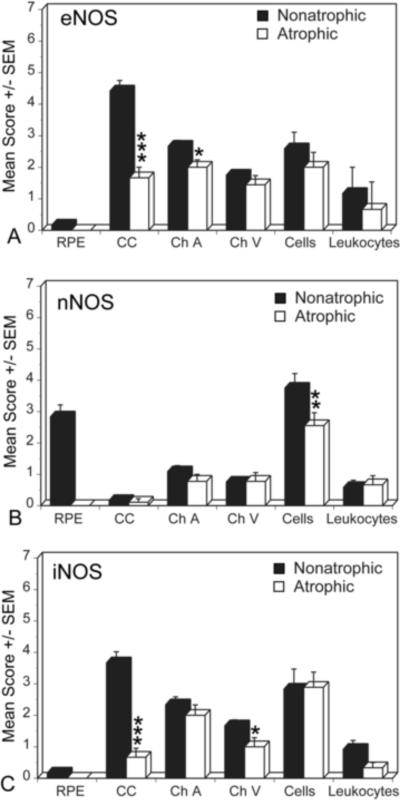
Figure 6.
Mean immunoreactivity scores±SEM for NOS isoforms in choroidal structures comparing atrophic (black) and non-atrophic (white) areas in a geographic atrophy (GA) subjects. The immunoreactivity scores for eNOS were significantly lower in choroidal arteries and CC in atrophic area compared to the non-atrophic area. The mean score for nNOS was significantly lower in perivascular nerve fibers, whereas the score for iNOS was significantly lower in choroidal veins and CC in atrophic area than in the non-atrophic area. The significance of the difference between the groups by t test is indicated: *= p<0.01, **= p<0.005, ***= p<0.001.

