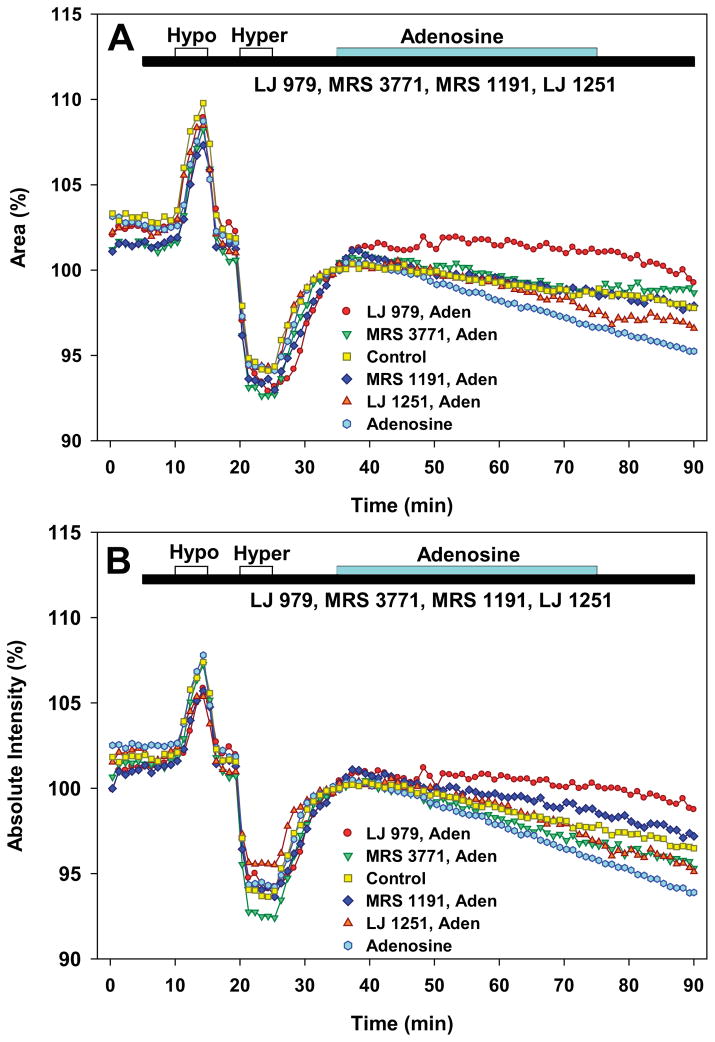
Figure 6.
Effects of A3 antagonists on cell volume of native bovine nonpigmented ciliary epithelial cells. Volume was simultaneously monitored as area (A) and calcein fluorescence quenching (B). For purposes of clarity, the standard errors have been omitted and the data points are averages of the three measurements obtained each minute. Results for each series of measurements are presented as means normalized to the average of the three points measured just before application of adenosine at 35 min. Brief initial perfusions with 25% hypotonic and 25% hypertonic solutions produced swelling and shrinkage, respectively. Adenosine (300 μM, Aden) produced cell shrinkage that was partially/completely prevented by perfusion with 300 nM LJ 979, 300 nM MRS 3771, 300 nM MRS 1191 or 150 nM LJ 1251. Data were analyzed by two-way ANOVA with the Bonferroni post-test.

