Figure 4.
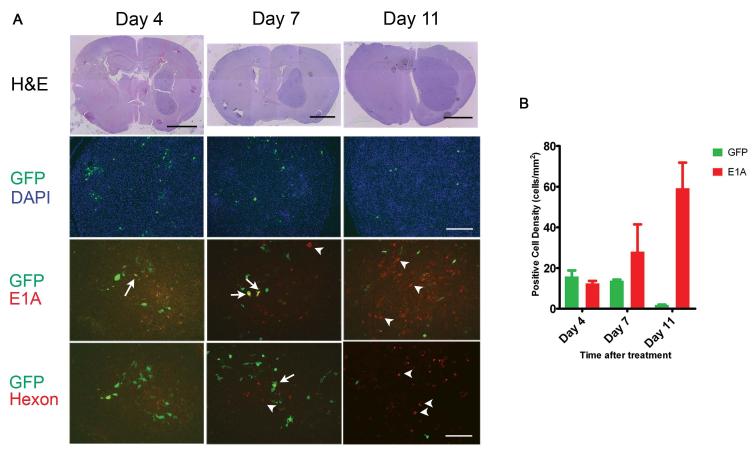
A, Immunofluorescence microscopy was used to track hMSCs and Delta-24-RGD over time after intracarotid delivery to U87MG xenografts. Brains were harvested 4, 7, and 11 days after treatment. Sections were cut and stained with H&E (Upper row). Sections were double immunostained with FITC-labeled anti-GFP antibody (green) and with Texas Red-labeled anti-E1A antibody (third row, red) or Texas Red-labeled anti-hexon antibody (lowest row, red). Sections were also stained with DAPI (second row). Green cells indicate hMSCs that are not expressing viral proteins; yellow cells indicate hMSCs that are expressing viral proteins; red cells indicate U87 tumor cells expressing viral proteins. Arrows indicate examples of hMSC double-expressing GFP and E1A (yellow cells). Arrow-heads indicate examples of E1A-expressing U87MG cells (red cells). The pattern indicates progression from green to yellow to red cells, suggesting movement of virus from hMSCs to glioma cells. H&E scale bars 2mm, GFP/DAPI scale bar 200μm, and EIA and hexon scale bars 100μm. B, Graph showing the density of GFP-positive cells (i.e., hMSCs) and adenoviral protein-expressing cells (i.e. cells supporting viral replication) within U87MG xenografts over the course of the experiment depicted in a. (p=0.0006 for interaction, 2-way ANOVA).

