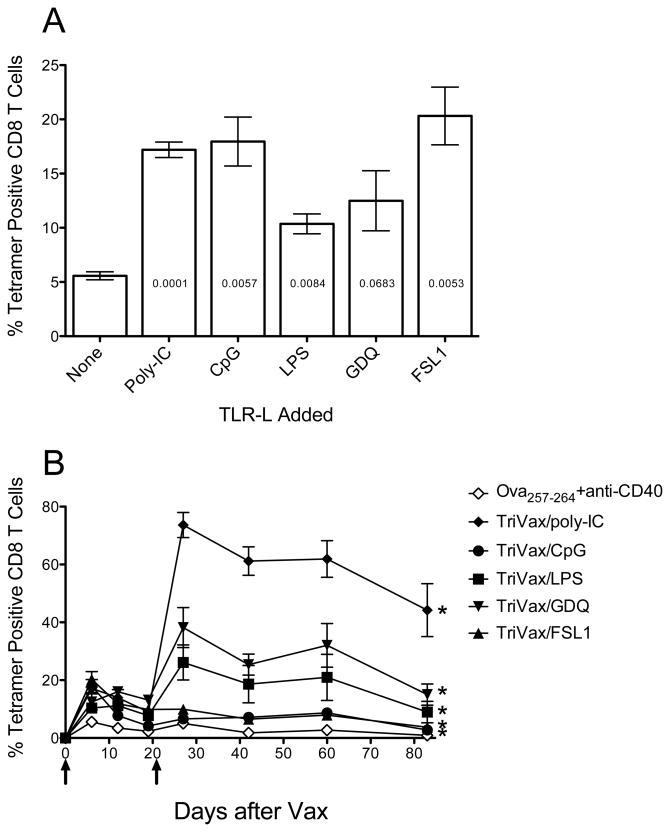
Figure 1. Effect of TLR-Ls on peptide vaccination with anit-CD40 mAb.
(A), B6 mince (3 per group) were immunized i.v. with Ova 257–264 peptide and anti-CD40 mAb and one of the following TLR-L: poly-IC (TLR3-L), CpG (TLR9-L), Lps (TLR4-L), GDQ (TLR7-L), FSL1 (TLR6/2-L). Seven days later, antigen-specific CD8 T cell responses were measured in blood by using tetramer analysis. Results represent the means and SD for each group where p values compared to the no TLR group are shown inside of each bar. (B), The mice received a second identical immunization (on day 21) and the frequency of tetramer-specific CD8 T cells in peripheral blood was followed in individual mice throughout various time points. Results correspond to the man and SD for each group. Arrows, times of vaccination. P values were calculated using two-way ANOVA test (*p < 0.0001 for TriVax versus peptide+anti-CD40 mAb).

