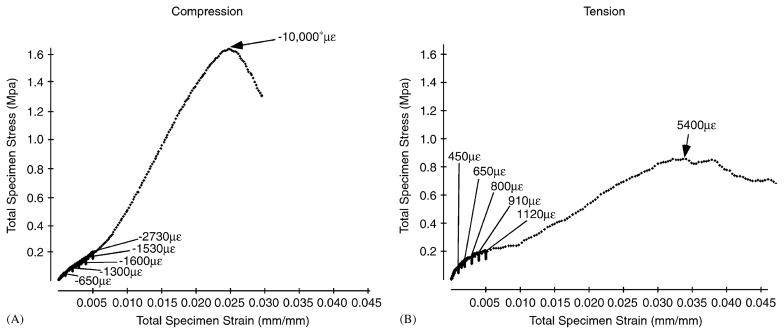
Fig. 3.
Stress–strain curves from relaxation and failure tests of nasofrontal sutures from older pigs in compression (A) and tension (B). The suture strains are given for relaxation tests at 0 s relaxation. The asterisk indicates that strain exceeded the gauge’s maximum. Sutural strain had similar ranges in compression and tension during relaxation testing; however, at peak stress sutural strain during compressive testing far exceeds that during tensile testing. Note that strain measured by strain gauges is less than the corresponding total specimen strain measured by the MTS machine. This consistent discrepancy may be due to the small area sampled by the gauge or to compliance in the testing set-up.

