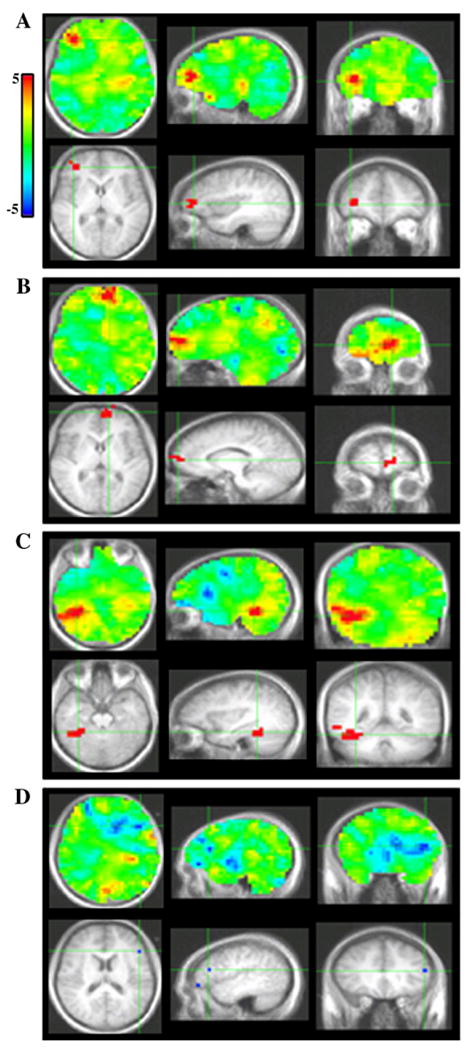
Fig. 4.

PLS bootstrap ratio plots from LV1. Unthresholded images (top); images thresholded at a bootstrap ratio of 4.5. Sources in A, right area 10, B, left area 10, C, right fusiform gyrus, D, left inferior frontal gyrus.

PLS bootstrap ratio plots from LV1. Unthresholded images (top); images thresholded at a bootstrap ratio of 4.5. Sources in A, right area 10, B, left area 10, C, right fusiform gyrus, D, left inferior frontal gyrus.