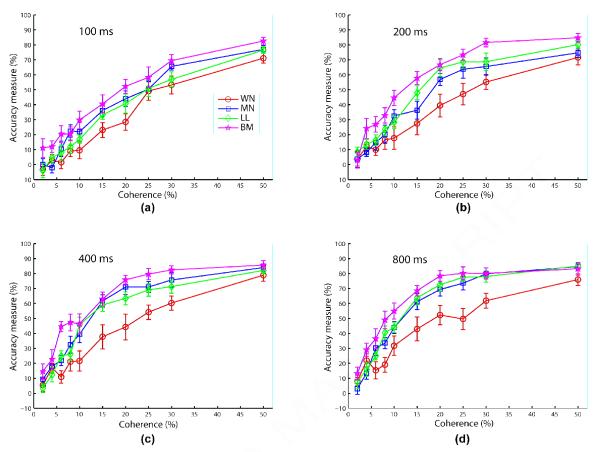
Figure 3.
Experiment 1 results comparing the coherence response functions, combined across the two sessions, of the four algorithms (WN: circle/blue; MN: square/green; LL: diamond/red; BM: penta-gram/cyan) at each viewing duration. Error bars represent standard error of mean. The legend for all panels is shown in (a). Fixed stimulus parameters are 18° aperture diameter, 12°/s speed, and high contrast.

