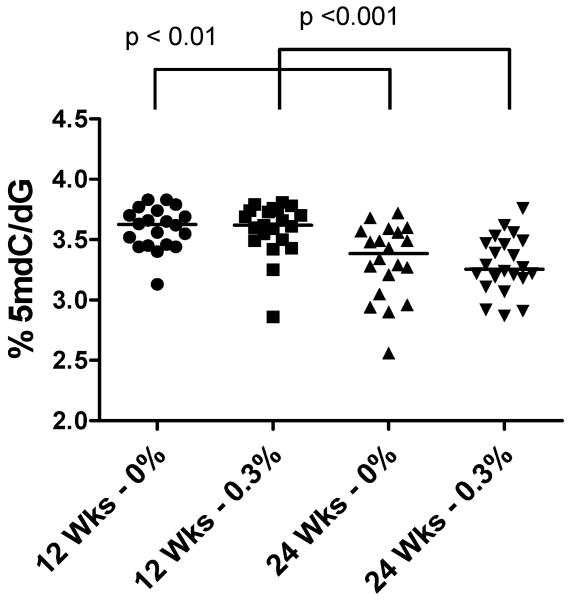
Fig. 2. Effect of GTP consumption on 5mdC levels in TRAMP mice.
5mdC levels in prostate from control or GTP-treated TRAMP mice at 12 and 24 weeks of age was determined by LC-MS analysis as described in Materials and Methods. Mice were administered GTPs beginning at 4 weeks of age. Each symbol represents an individual sample and the bar indicates the median of each group. Mann-Whitney Test was used to determine significant differences.

