
Figure 2.
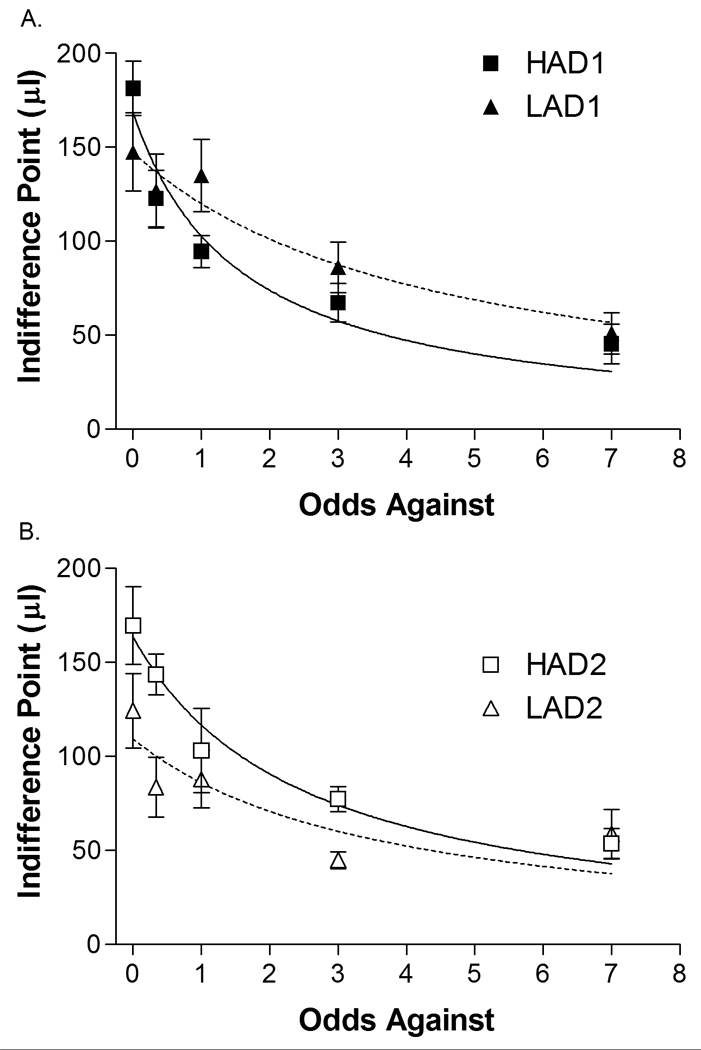
Mean ± SEM indifference point for each line at each odds against (0, 0.33, 1, 3 and 7). Data for replicate 1 are shown in the top (a) graph and for Replicate 2 in the bottom (b) graph. A significant LINE × ODDS AGAINST interaction suggests that HAD animals were more sensitive to probabilistic rewards than LAD animals. HAD1 n = 6, HAD2 n = 6, LAD1 n = 6, LAD2 n = 5.