
Figure 3.
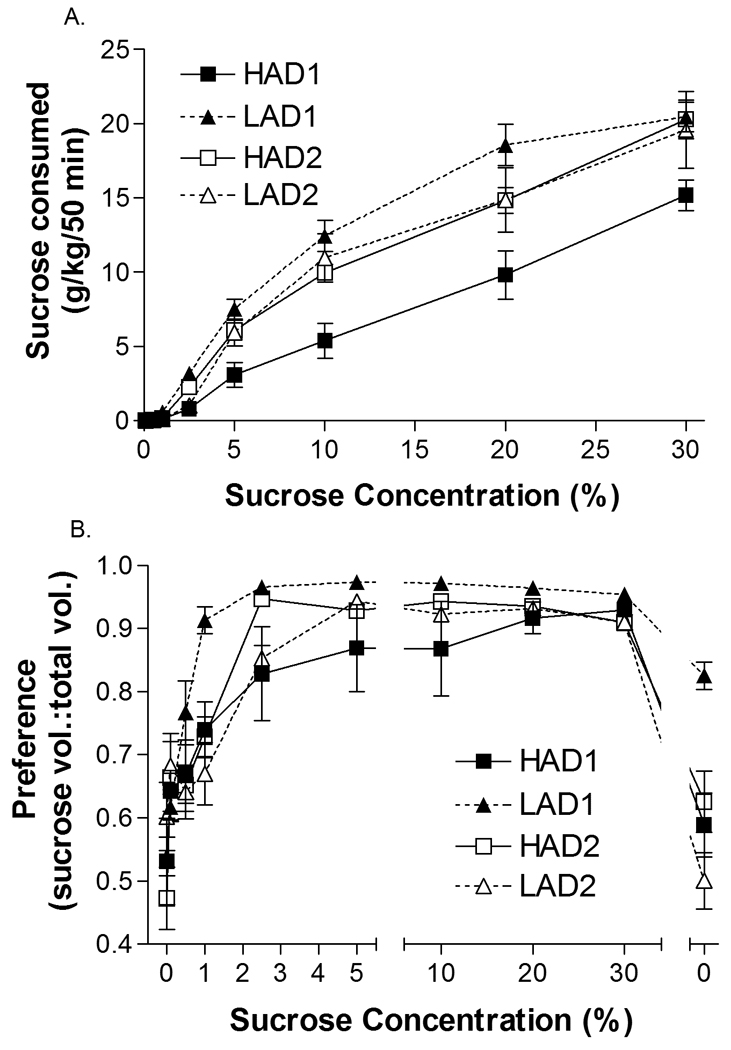
Consumption and preference for reinforcer were similar in both HAD and LAD rats. HAD1 n = 6, HAD2 n = 6, LAD1 n = 6, LAD2 n = 6. Panel a illustrates the mean ± SEM amount of sucrose consumed by each strain in g of sucrose consumed per kg of body weight. Sucrose concentrations ranged from 0–30% sucrose (w/v). Panel b illustrates the mean ± SEM preference ratio between the sucrose solution and water. Preference ratio was calculated as volume of sucrose consumed/total volume.