
Figure 4.
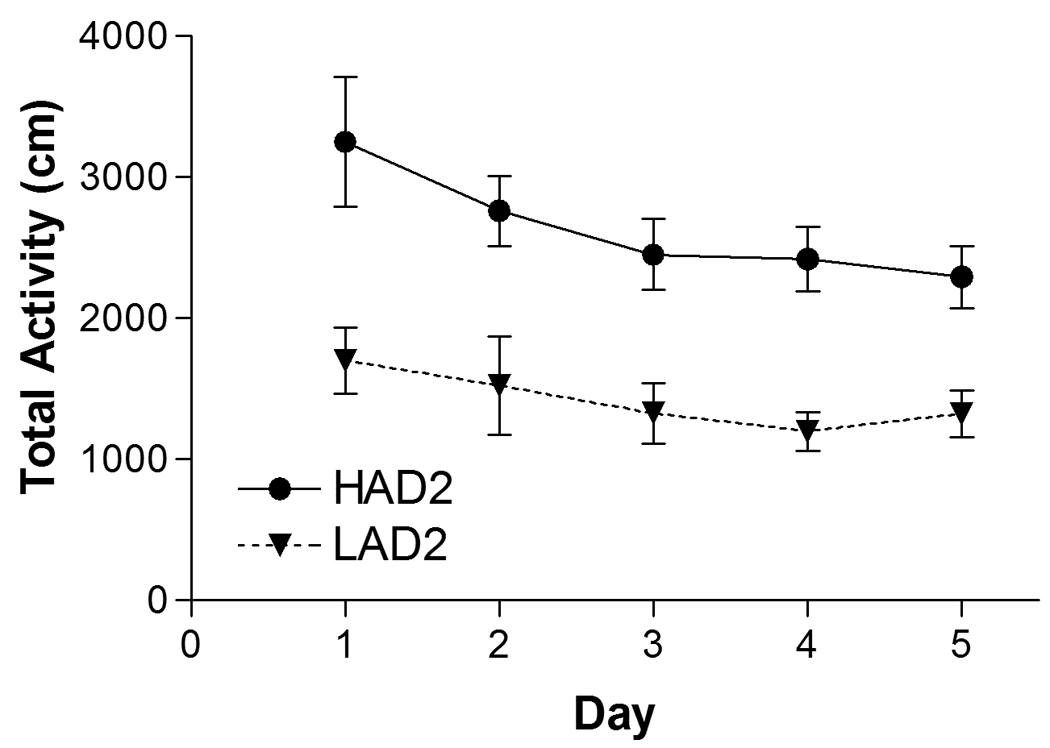
Mean (± SEM) of the total horizonal activity (in cm) for each line during a 30 minute session. HAD2 rats were more active than LAD2 rats (* denotes main effect of LINE: F(1, 9) = 31.6, p < 0.001). Locomotor activity decreased as the animals habituated to the chamber (main effect of DAY: F(3.1, 28.0) = 3.2, p = 0.035). HAD1 n = 6, HAD2 n = 6, LAD1 n = 6, LAD2 n = 6.