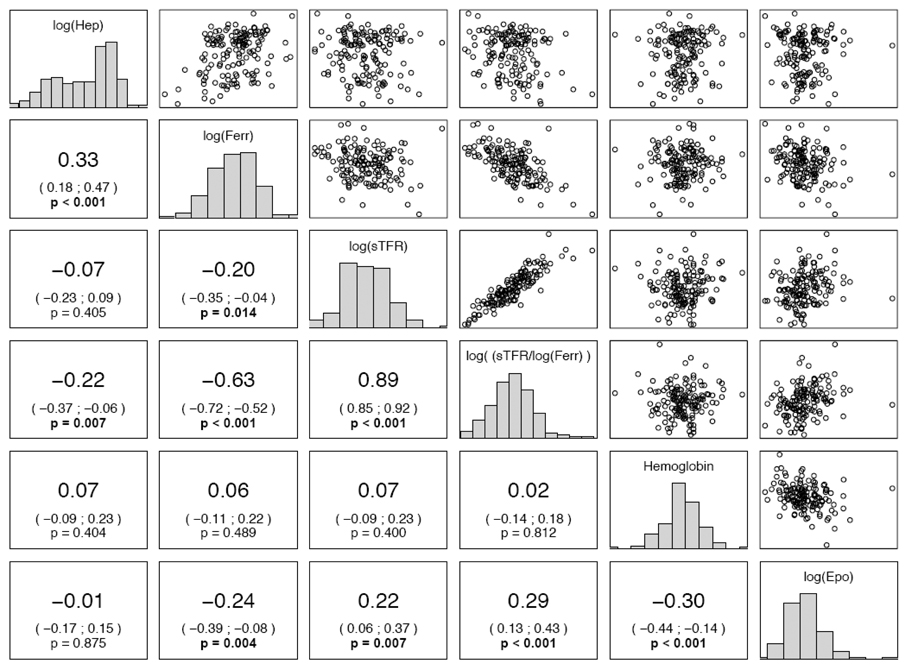
Figure 1. Pairwise scatterplots and correlations among indicators of iron metabolism among 149 Bangladeshi women.
On the diagonal, the marginal distributions are shown as histograms. In the lower left triangle of the figure, we indicate the respective correlation coefficients, confidence intervals, and p-values. P-values less than 0.05 are shown in bold face. For clarity, and since correlations are scale independent, we omitted the axis labels. Urinary hepcidin, intensity/mMol creatinine, is abbreviated Hep; ferritin, µg/L, is abbreviated ferr.

