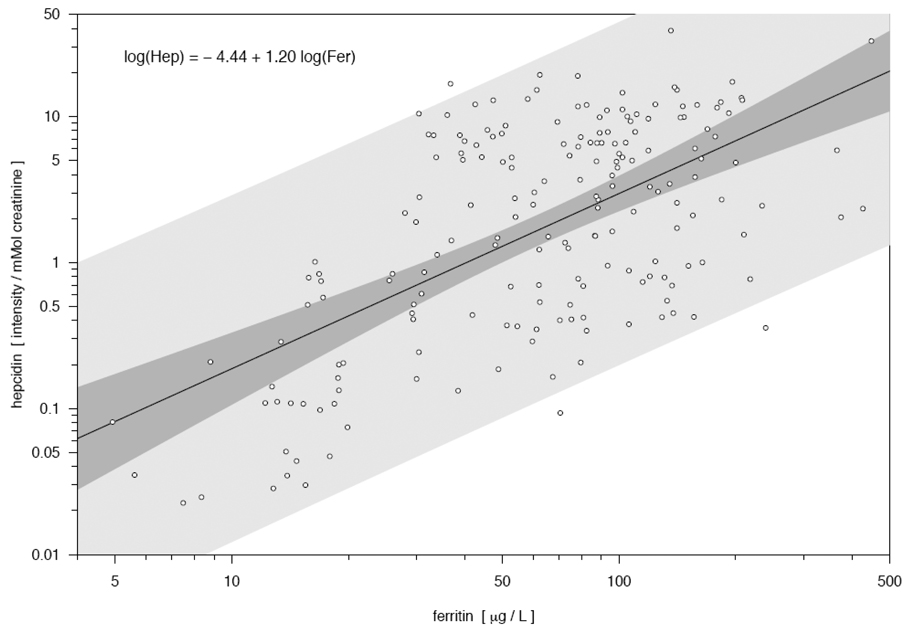
Figure 2. Scatterplot and linear relationship between hepcidin (intensity/mmol creatinine) and ferritin (µg/L), both expressed on a log scale, among 190 Bangladeshi women.
The relationship between ferritin and hepcidin was statistically significant (P < 0.001). The darker band is a confidence band for the regression line, while the lighter gray band represents pointwise prediction intervals for future observations, based on the relationship observed in this study.

