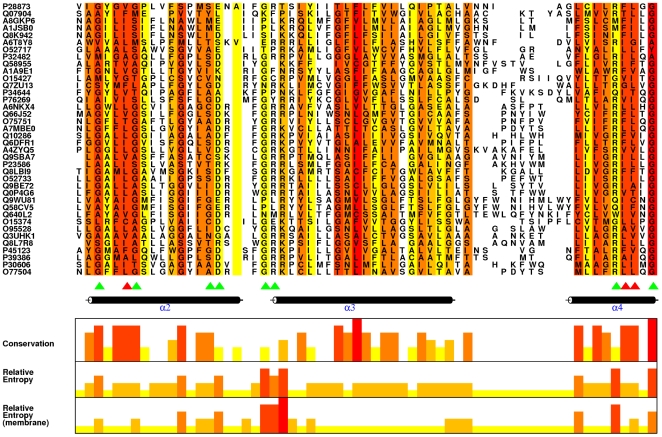
Figure 1. A portion of Multiple Alignment showing conservation and REM for each column.
Figure showing a representative portion of the alignment of MFS sequences and is generated using Alscript [48]. The alignment is coloured in a gradient from red to yellow on the basis of decreasing conservation score. Conservation was calculated using a method by Livingstone et al. [49] and the scores are shown as a histogram. The histogram compares the conservation, RE and the REM scores for the alignment columns shows in the figure. Results of selected mutations in CaMdr1p are indicated by triangles, green being sensitive while red are resistant. REM scores are better indicators of functional relevance than physicochemical conservation.

