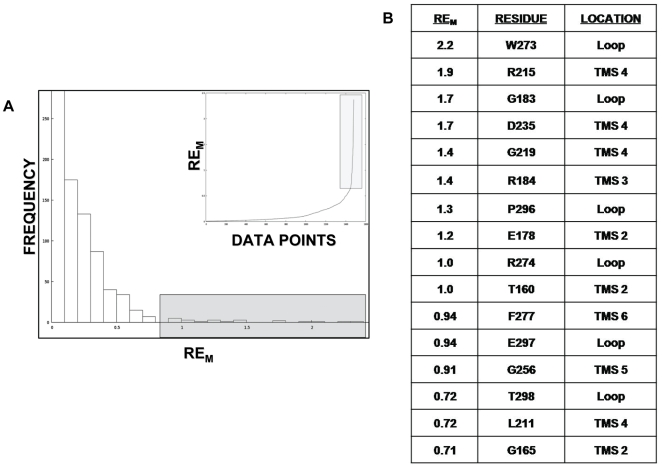
Figure 2. Distribution curve of REM values of complete MSA.
Panel A: Histogram of the REM scores (+ve/background frequency) vs frequency for all positions of MSA of the MFS transporters. The top 30 REM positions depicted in the boxed region were selected for further analysis. The inset represents the same data by a line graph. B: The table shows 16 out of the top 30 high REM alignment positions where the residue in CaMdr1p matched with the most frequent amino acid at that particular position in a MSA of 342 MFS members. Their predicted location with respect to CaMdr1p is also displayed in the next column.

