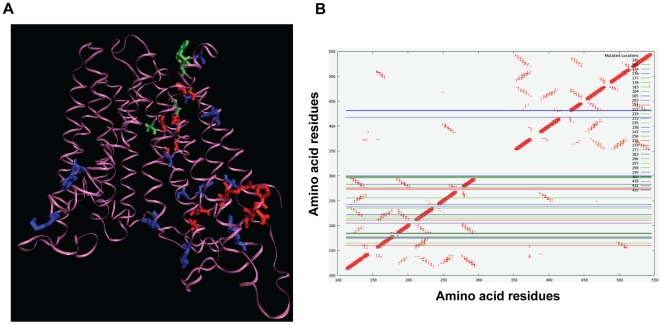
Figure 5. The 3D homology model of CaMdr1p and the contact map derived from it.
Panel A: The 3D homology model of CaMdr1p wherein the mutated residues are marked onto the model and are coloured on the basis of the phenotypes exhibited upon mutation. Red denotes sensitive, green shows resistant and blue marks a position predicted to be important but not mutated as the CaMdr1p residues did not match the conserved residue in that alignment position. The structure is viewed using Visual Molecular Dynamic (VMD) software. B: The contact map of CaMdr1p is plotted between all the residues vs all the residues and displays the interactions between the beta carbon of each residue and beta carbon atoms of every other residue within and up to 8 A° of distance (Cα is used for glycine). Each cross points to an interaction between a residue on x-axis and a residue on y-axis. The lines represent the top thirty high REM residues and are coloured on the basis of the phenotypes where green represents the residues that are sensitive upon mutation while red are the ones that do not show any phenotype. The blue lines mark the residues in CaMdr1p that did not match with the most frequent residue in that particular column of the MSA.

