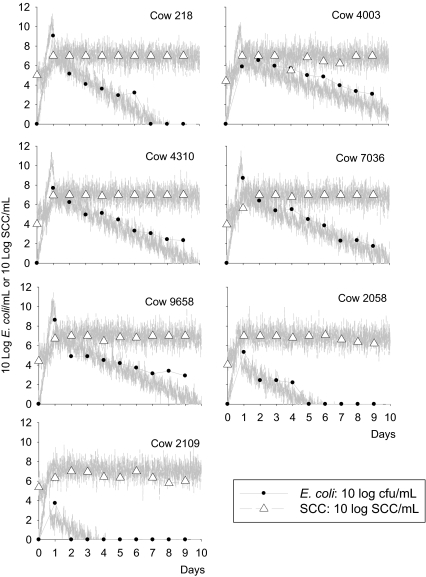
Figure 2.
Observed (points) and model predicted (lines) bacteria count and SCC data for seven cows with transient infections. Cow numbers are shown on the top-right of each graph. The model prediction is a single realisation of the stochastic version of the model including variation in measurement based on the standard deviations of the model fit to the data (σ E and σ S).

