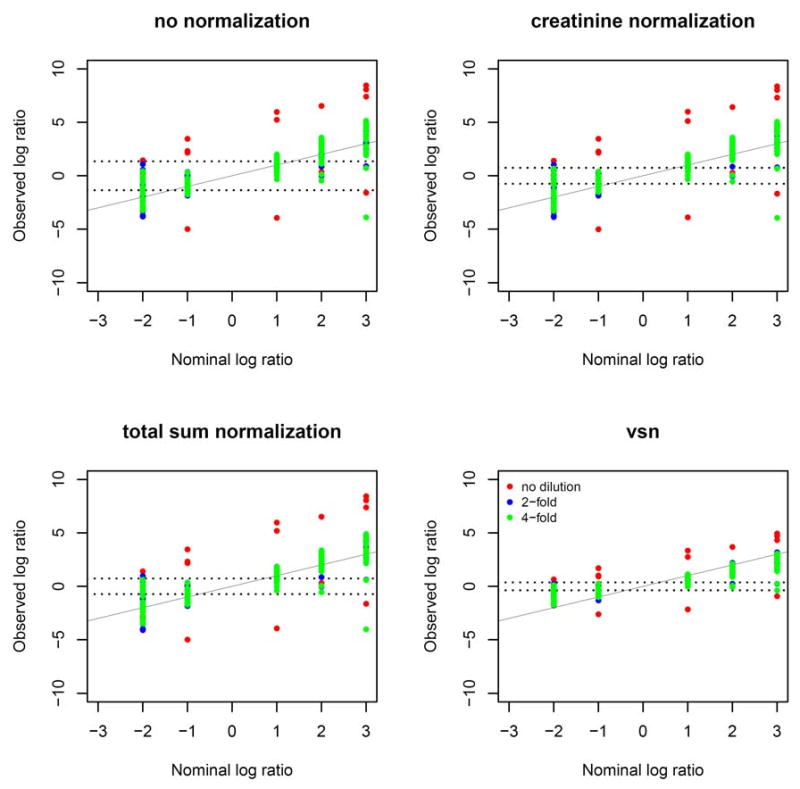
Figure 1.

Observed log fold changes are plotted against nominal log fold changes for all metabolites, separately for each dilution. The fold changes are taken with respect to a baseline concentration of 800uM. The solid line represents the expected pattern. The dotted lines denote the 75th quantile of standard deviations of the background metabolites. Colors indicate dilution types.
