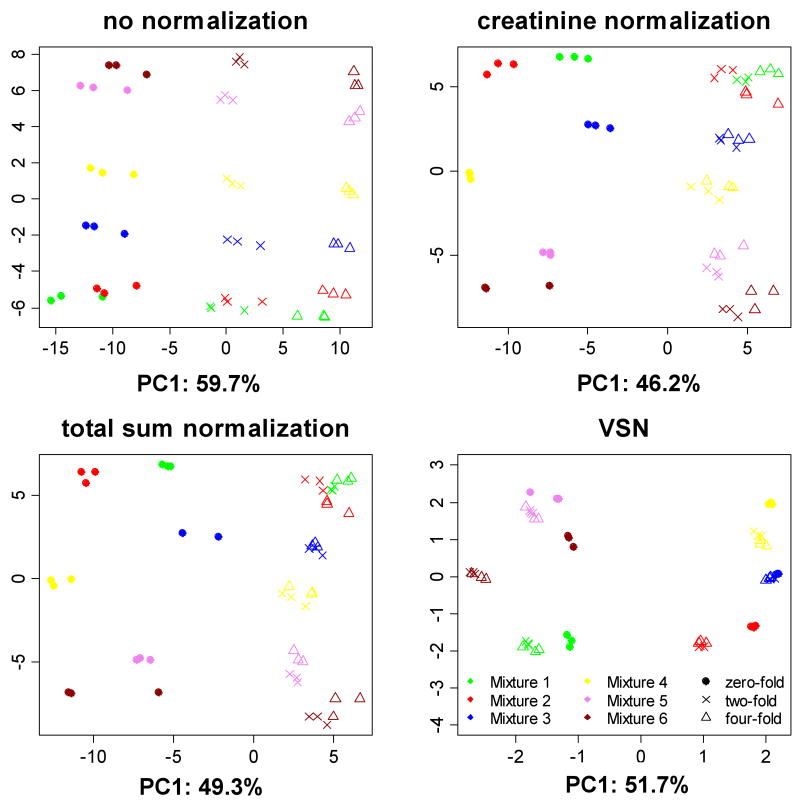
Figure 2.
PCA score plots for the 54 spectra in the spike-in dataset. X and Y axes are the first and the second principal components, respectively. Colors indicate the six mixture types, and shapes indicate the three dilution levels. VSN gives rise to the best performance in minimizing the dilution effect.

