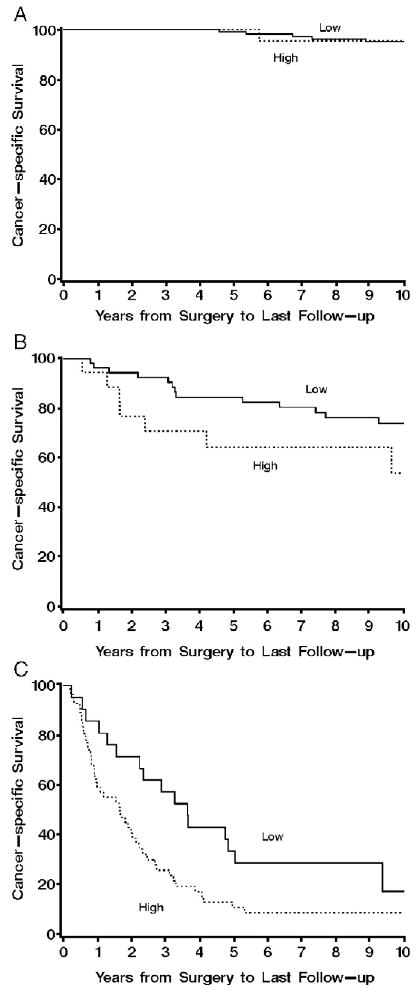
Fig. 4.

A, Association of survivin expression by VA with death from RCC for 158 patients with ccRCC determined to be low risk with SSIGN scores of 0 to 2 (risk ratio = 0.81; 95% CI, 0.10-6.75; P = .848). Cancer-specific survival rates (SE, number still at risk) at 1, 5, and 10 years after nephrectomy were 100.0% (0, 27), 100.0% (0, 22), and 95.5% (4.4%, 15), respectively, for patients with tumors that had ≥15 survivin-positive cells per square millimeter compared with 100.0% (0, 118), 99.1% (0.9%, 107), and 95.1% (2.1%, 74), respectively, for patients with tumors containing <15 survivin-positive cells per square millimeter. B, Association of survivin expression by VAwith death from RCC for 76 patients with ccRCC determined to be moderate risk with SSIGN scores of 3 to 6 (risk ratio = 3.23; 95% CI, 1.40-7.43; P = .006). Cancer-specific survival rates (SE, number still at risk) at 1, 5, and 10 years after nephrectomy were 94.4% (5.4%, 17), 64.4% (11.7%, 10), and 53.7% (13.8%, 4), respectively, for patients with tumors that had ≥15 survivin-positive cells per square millimeter compared with 96.3% (5.0%, 52), 84.6% (5.0%, 41), and 74.0% (6.3%, 30), respectively, for patients with tumors containing <15 survivin-positive cells per square millimeter. C, Association of survivin expression by VA with death from RCC for 76 patients with ccRCC determined to be high risk with SSIGN scores of 7 or greater (risk ratio = 1.99; 95% CI, 1.13-3.50; P = .017). Cancer-specific survival rates (SE, number still at risk) at 1, 5, and 10 years after nephrectomy were 59.0% (6.7%, 30), 10.7% (4.5%, 5), and 8.5% (4.1%, 3), respectively, for patients with tumors that had ≥15 survivin-positive cells per square millimeter compared with 85.7% (7.6%, 18), 33.3% (10.3%, 14), and 17.1% (8.6%, 3), respectively, for patients with tumors containing <15 survivin-positive cells per square millimeter.
