
Figure 3.
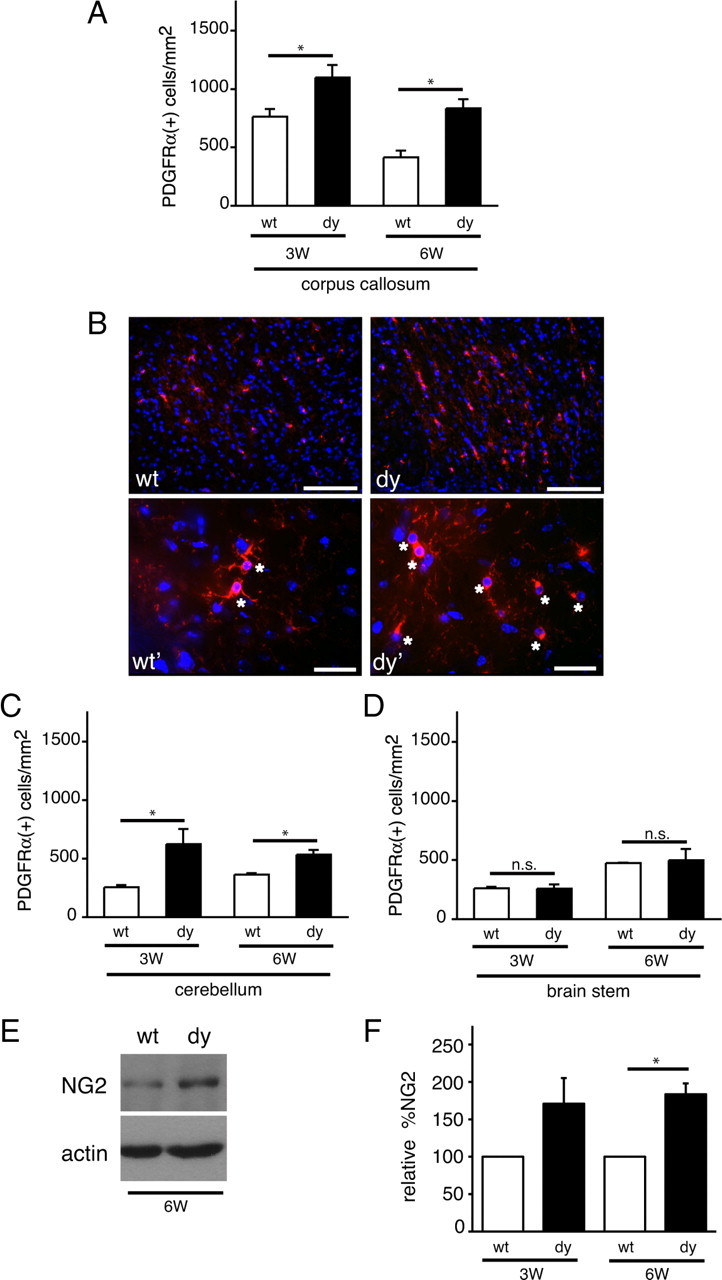
Oligodendrocyte progenitors accumulate in dy/dy brains. A, Oligodendrocyte progenitor cells per square millimeter in the corpus callosum were measured in wild-type (wt; white bars) and dy/dy (dy; black bars) littermates at 3 weeks (3W) and 6 weeks (6W) of age using PDGFRα immunocytochemistry. Graphs are mean (±SEM) counts obtained from 7 different areas of the corpus callosum (n = 3; *p < 0.05). B, Top panels, Representative images of PDGFRα(+) oligodendrocyte progenitors (red) in the corpus callosum of 3-week-old wild-type and dy/dy brains. Nuclei are visualized using DAPI (blue). Scale bar, 100 μm. Bottom panels, Representative images of PDGFRα(+) oligodendrocyte progenitors (red; indicated by *) in the corpus callosum of 3-week-old wild-type (wt') and dy/dy (dy') brains obtained at higher magnification. Scale bar, 25 μm. C, Oligodendrocyte progenitor cells per mm2 in the proximal cerebellar white matter were measured in wild-type (white bars) and dy/dy (black bars) littermates at 3 weeks and 6 weeks of age. Graphs are mean (±SEM) counts obtained from 6 different areas of the proximal cerebellar white matter (n = 3; *p < 0.05). D, Oligodendrocyte progenitor cells per mm2 in the brainstem were measured in wild-type (white bars) and dy/dy (black bars) littermates at 3 weeks and 6 weeks of age. Graphs are mean (±SEM) counts obtained from 3 different areas of the brainstem (n = 3; n.s, not significant). E, Lysates from 6-week-old cerebella were evaluated by Western blot to detect NG2 protein relative to actin as a loading control. A representative blot from a wild-type and dy/dy littermate is shown. F, Relative densitometry of NG2 protein levels at 3 weeks and 6 weeks in dy/dy cerebella compared with paired littermate wild-type cerebella (n = 4, *p < 0.05).