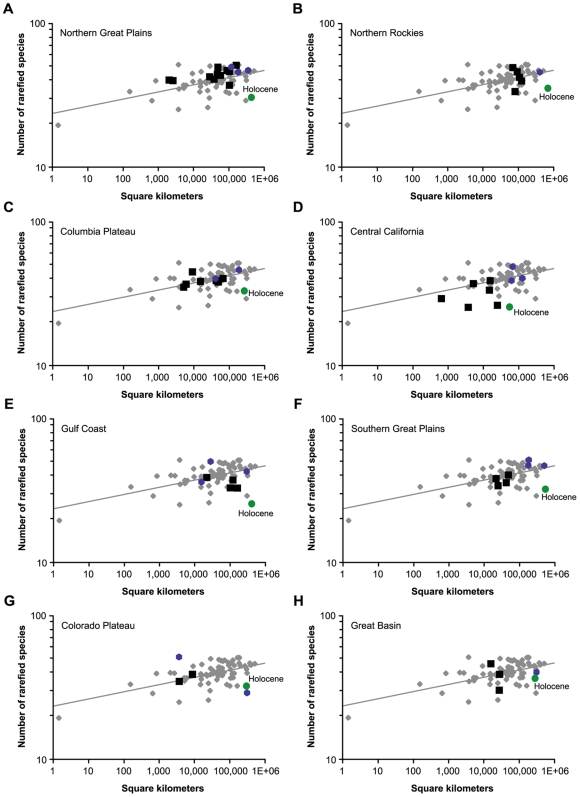
Figure 3. Rarefied species richness values plotted versus total geographic area through which the localities are distributed.
The gray diamonds and line show paleospecies area relationships for the entire pre-Holocene data set as in Figure 2B; the black squares represent each of the respective intraprovincial data points for Oligocene and Miocene time slices (30–4.7 Ma); the blue hexagons represent each of the respective intraprovincial data points for the Blancan, Irvingtonian, and Rancholabrean time slices (4.7 Ma–11,500 years ago); and the green circle shows the Holocene time interval. (A) Northern Great Plains (NGP in Figure 1). (B) Northern Rockies (NR). (C) Columbia Plateau (CP). (D) Central California (CC). (E) Gulf Coast (GC). (F) Southern Great Plains (SGP). (G) Colorado Plateau (CRP). (H) Great Basin (GB).

