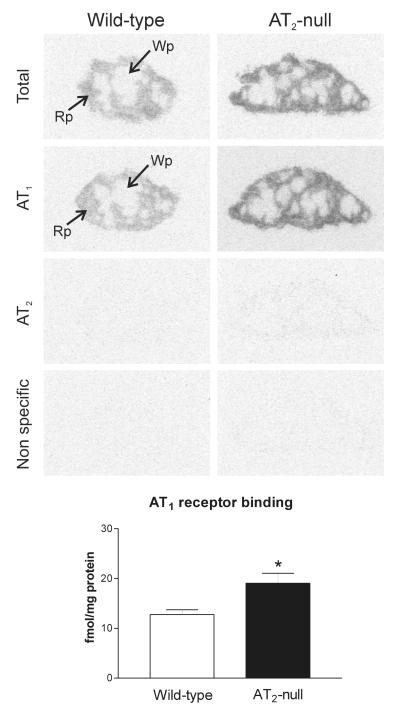
Figure 2.
Angiotensin II receptor binding in spleen of wild-type and AT2 −/− mice. Autoradiograms represent [125I]-Sar1-Ang II binding in the absence of selective ligands, in the presence of PD123319, losartan or Angiotensin II to visualize total binding, AT1 receptors, AT2 receptors and nonspecific binding as described in Material and Methods. Quantitative data are means ± SEM for group of five animals, measured individually. Note that AT1 receptor binding is significantly higher (*p<0.05) in AT2 −/− mice and is restricted to the red pulp. Wp – white pulp, Rp – red pulp.

