Figure 1.
Figure 1a. Sex-adjusted mean BMI by decade among participants with and without diabetes (DM) in the Framingham Heart Study, 1970–2005.
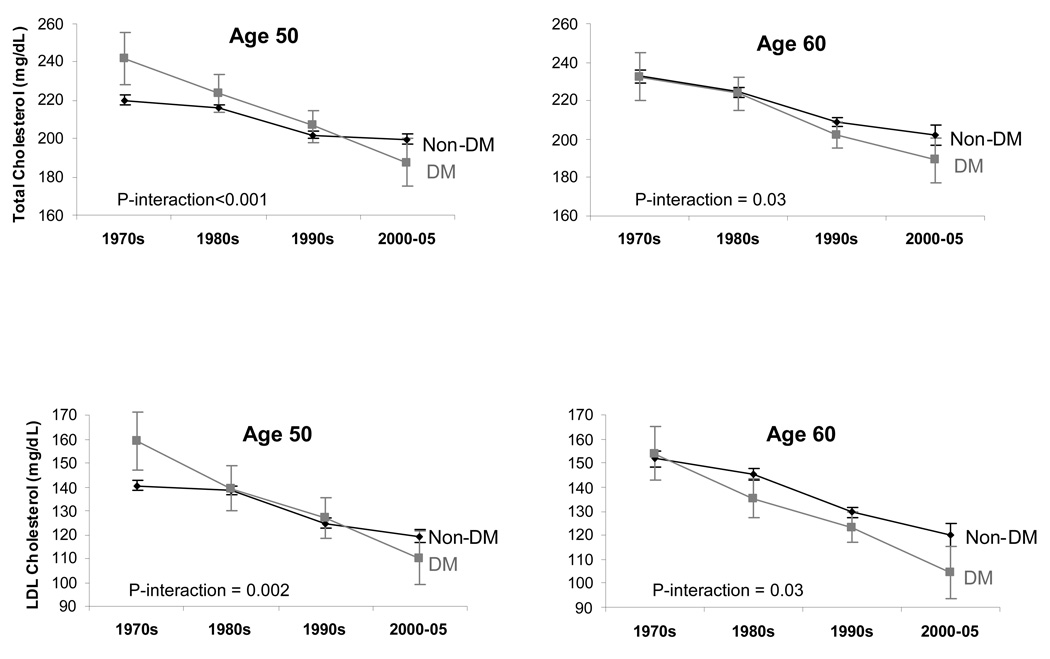
Figure 1b. Sex-adjusted mean total and LDL cholesterol levels by decade among participants with and without diabetes (DM) in the Framingham Heart Study, 1970–2005.
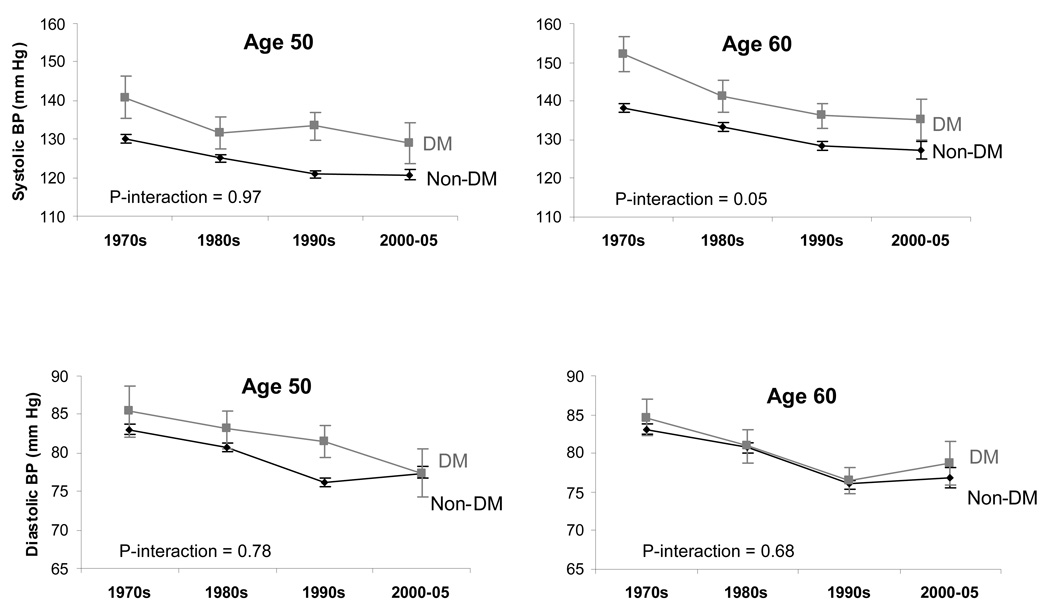
Figure 1c. Sex-adjusted mean systolic and diastolic blood pressure levels by decade among participants with and without diabetes (DM) in the Framingham Heart Study, 1970–2005.


