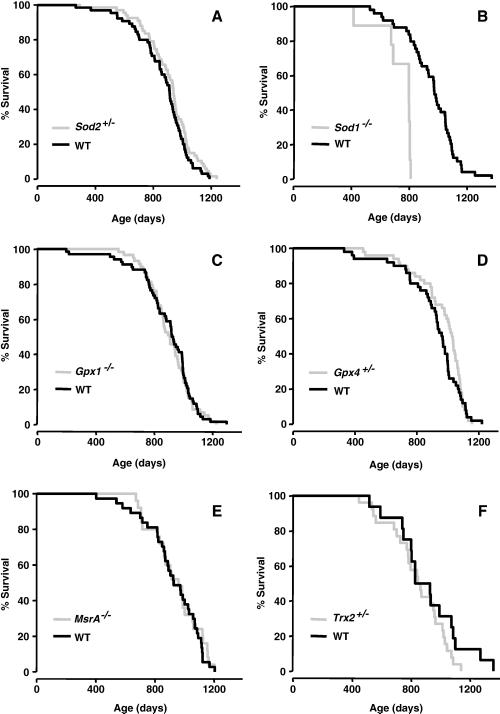
Figure 1. Lifespans of knockout mice with a deficiency in various antioxidant enzymes.
The survival curves of Sod2+/- (Graph A; [17]), Sod1-/- (Graph D; unpublished), Gpx1-/- (Graph C; [43], Gpx4+/- (Graph B; [16]), MsrA-/- (Graph E; [42], and Trx2+/- (Graph F; unpublished) mice are shown compared to their WT cohorts. The genetic background, number, sex and survival data for these curves are given in Table 2.

