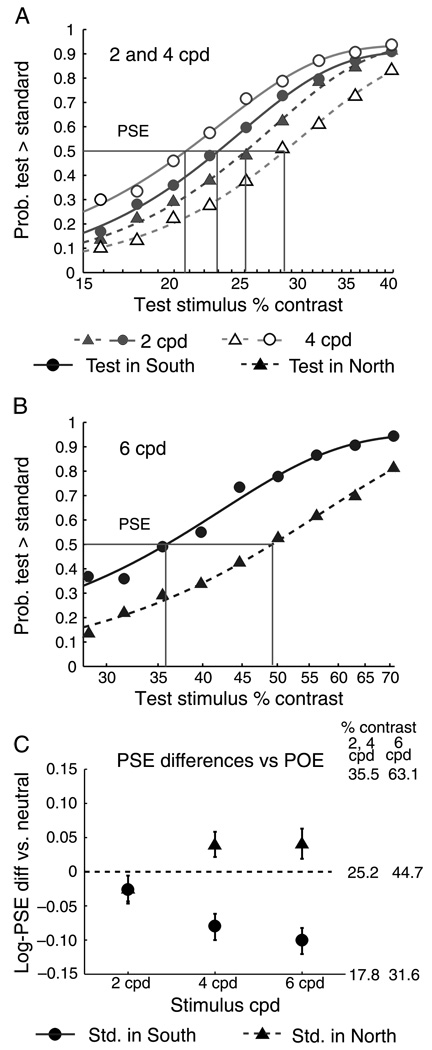
Figure 2.
Results of Experiment 1. Panel A: pooled psychometric functions for 2 and 4 cpd stimuli. Panel B: functions for 6 cpd stimuli. Panel C: summary of mean PSEs when Test stimulus is in the South (dots) and in the North (triangles). PSEs are lower than the POE when the Test is in the South, and higher when it is in the North. Stimuli appear to have higher contrast in the South and lower contrast in the North.

