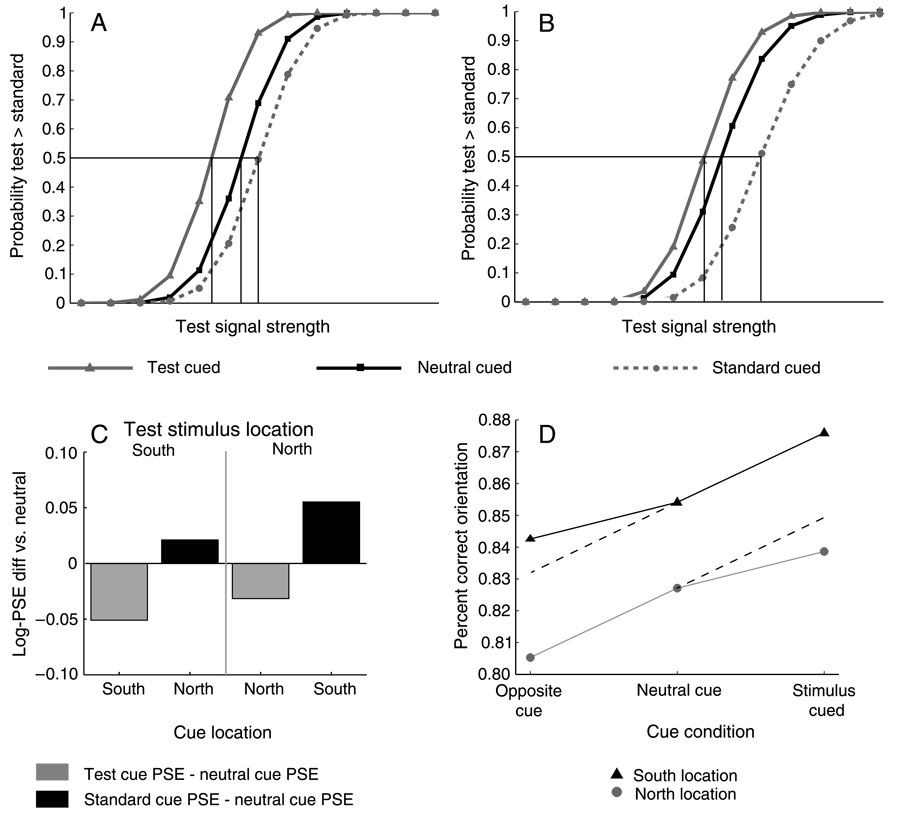
Figure 9.
Appearance Model Results (panels A, B, and C): Model-generated psychometric functions when the Test stimulus is in the South (panel A) and North (panel B) have asymmetrical shifts in peripherally cued conditions as the data from Experiment 2 and 3 (compare to Figure 3 and Figure 5). Panel C plots the model PSE shifts for peripherally cued conditions relative to Neutral in the same format as Figure 4 and Figure 6. Discrimination Model Results (panel D): Assumptions of differential attentional modulation in South and North locations produces asymmetrical performance effects. Dotted lines represent symmetrical effects when North and South attention factors in the model are equal.

