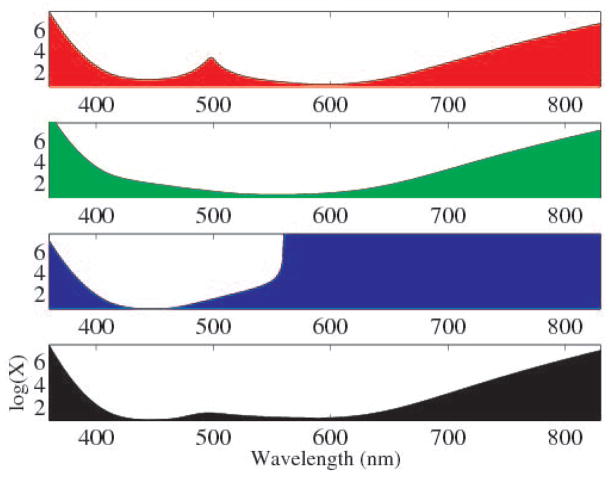
Fig. 2.
Log of the maximum spectral difference between two metamers at each wavelength (assuming the spectra are otherwise equal), for a color matching tolerance of ε = 5%. Red (top), green (2nd), and blue (3rd), represent CIE X, Y and Z, respectively. Black (bottom) shows the maximum difference for the magnitude of all three channels.

