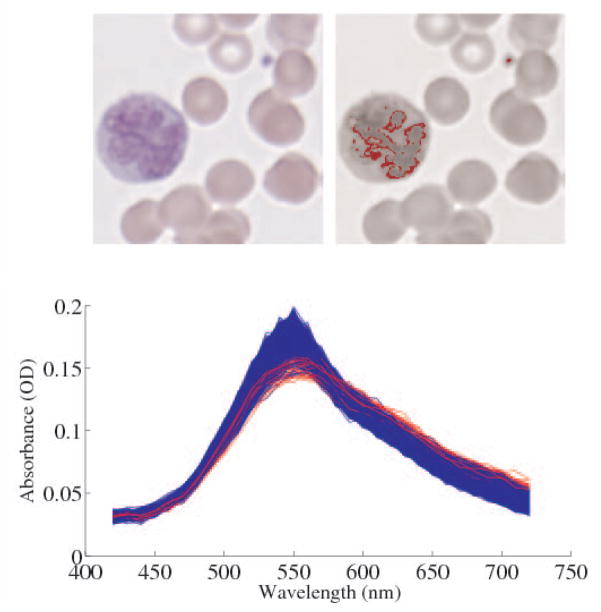
Fig. 5.
Top left: 60× RGB image of a blood smear showing a neutrophil (large polynuclear cell on left), red cells, and a platelet (small blue dot). Top right: The 1000 closest pixels to the RGB color of the platelet are highlighted in red. Bottom: The spectra of the neutrophil pixels are plotted in blue, while those of the platelet are plotted red.

