
Figure 1. Stimulus Set-Up and the Behavioral Effects of Attention.
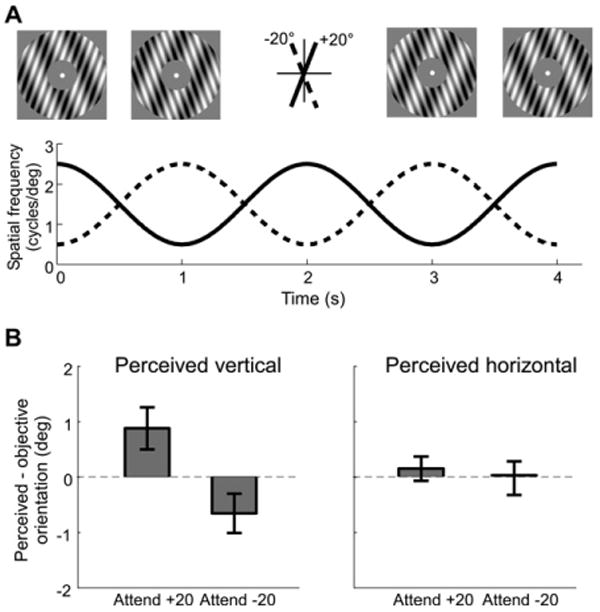
(A) The adapting stimulus. The orientations of the two components are denoted as “+20°” and “−20°,” respectively. The graph shows the modulation of the spatial frequency of the two component gratings (+20°: solid line; −20°: dashed line). The images at the top illustrate the appearance of the stimulus at four different time points: 0, 1, 3, and 4 s. A contrast reversal occurs at 2 s (note that the contrasts of the individual gratings at 0 and 4 s are reversed; the same is true for the gratings at 1 and 3 s).
(B) The effect of attention on the tilt aftereffect (TAE). Left panel shows the difference between the perceived and objective vertical (0°) orientation when attending to one of the component gratings (Attend +20, Attend −20). Right panel shows the difference between the perceived and objective horizontal (90°) orientation. Dashed line indicates no shift in perceived vertical (left) or horizontal (right). Error bars are ±1 SEM across observers.