
Figure 5. Correlation between Attentional Modulation Index and TAE.
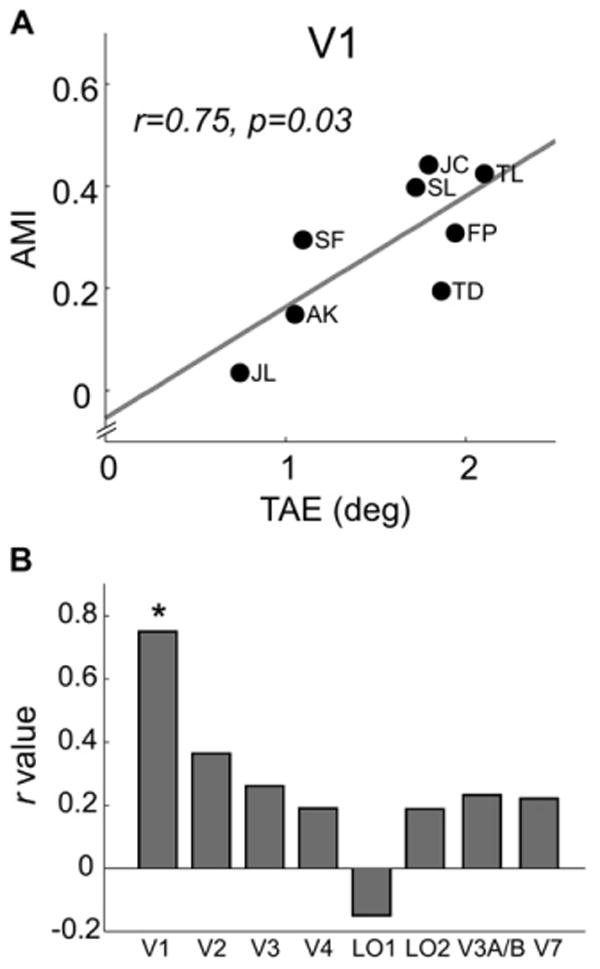
TAE was defined as the difference between the perceived vertical orientations in the Attend +20 and Attend −20 conditions.
(A) Scatter plot of attentional modulation index (AMI) versus TAE for V1. Each symbol represents an observer (with initials affixed); the correlation coefficient and the associated p value are also shown.
(B) Correlation values (r) for all visual areas examined (asterisk indicates significant correlation, p < 0.05).