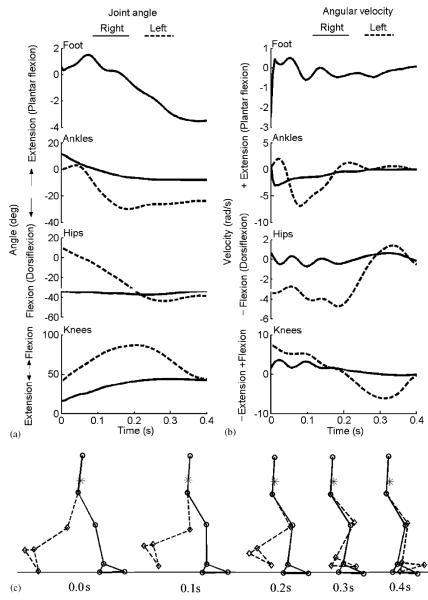
Fig. 3.
Simulated joint angular displacements (a), joint angular velocities (b), and stick-figure animation (c) for successful balance recovery starting from a normalized COM position of −0.75 during walking. The solid and dash lines are for the right and left sides, respectively. For both ankles and both hips, positive values represent extension (plantar flexion for the ankle); while for both knees, positive values indicate flexion. The number beneath each stick figure indicates the simulation time, and the asterisk represents the COM position.

