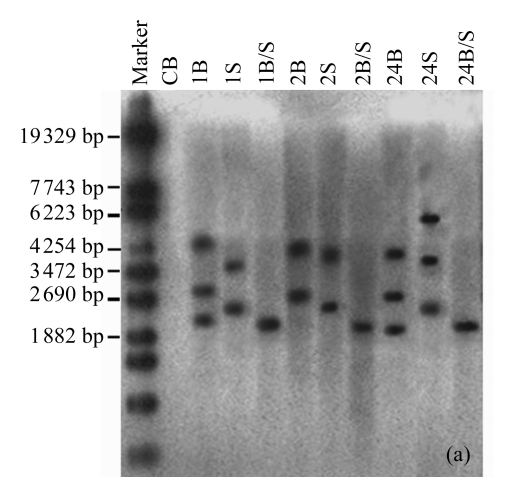
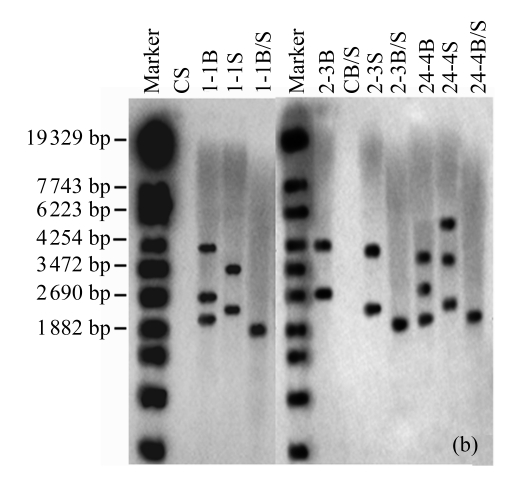
Fig.4.
Southern blotting analysis in T0 and T1 plants
The blots show the results of (a) three T0 plants (samples 1, 2, 24) of Liaodou 14 and (b) their progeny T1 plants (samples 1-1, 2-3, 24-4) with BamHI (B) and SacI (S), or BamHI/SacI (B/S). C: soybean plants from the flowers transformed with 0.1× SSC


