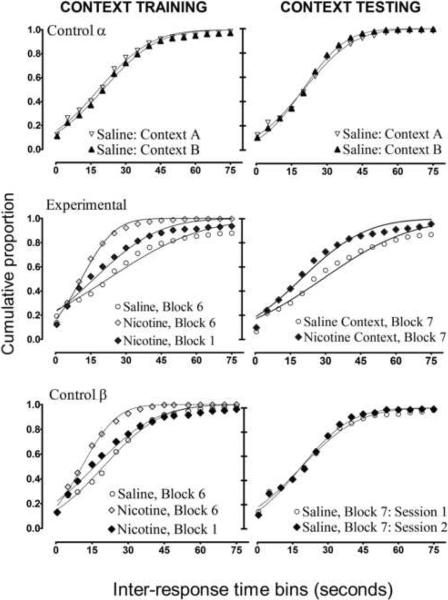
Figure 3.
Cumulative inter-response time (IRT) frequency distributions for all groups per experimental condition. Each curve represents the data for all members of each group per experimental condition. The lines fitted to each curve on each figure are the results of the nonlinear regression analysis. The top two figures show the IRT distributions for control-group α(n = 4), and this figure shows that the particular experimental contexts failed to produce differential DRL-schedule performance in any phase of experimentation. The middle two figures represent the data for the experimental group (n=8). The results for context training demonstrated an effect of sensitization; the IRT distribution became more abrupt after 12 consecutive-daily dosing of 0.3mg/kg nicotine (compare Block 1 vs. Block 6). During context testing (Block 7) in the absence of nicotine, the nicotine-associated context (i.e. “nicotine context') elicited a higher proportion of short IRT's. The bottom two figures depict the results from the control group that received nicotine during the 12 days of context training, but nicotine administration was not exclusively paired with a reliable context. The results for this group during testing show the absence of a lingering effect of nicotine once nicotine administration was terminated.

