
Figure 1.
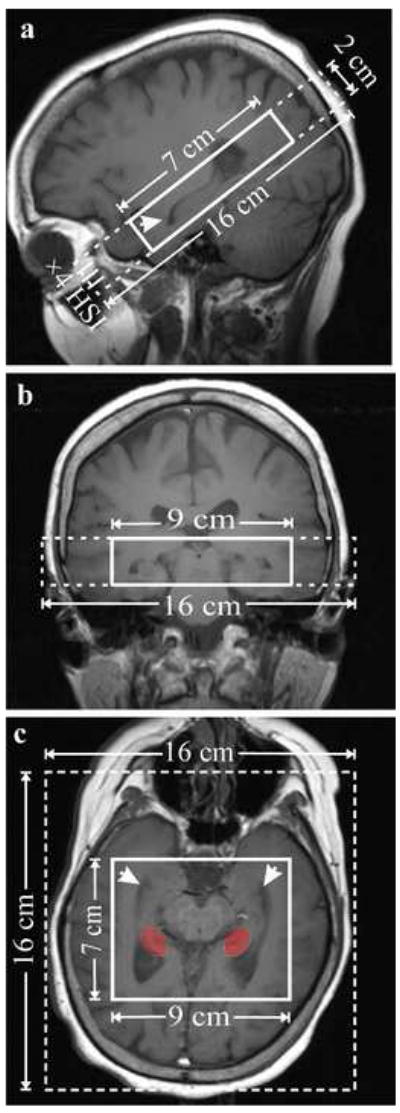
Sagittal (a) and coronal (b) and paraxial (c) T1-weighted images, along the hippocampus axis, depicting the position and angulation of the 16AP×16LR×2IS cm3 FOV (dashed line) and 7AP×9LR×2IS cm3 VOI (solid line) centered on the hippocampi (arrows). The red indicates the region of the hippocampus from where the spectra were sampled.