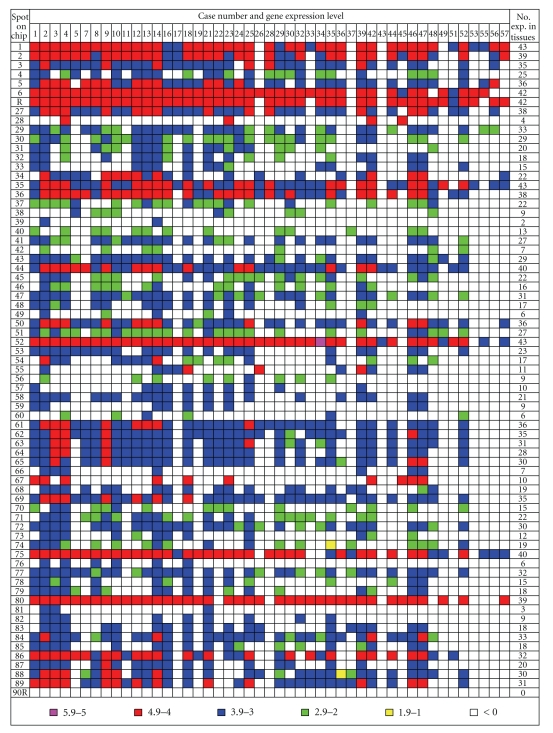
Figure 2.
Hierarchical presentation of EBV gene expression patterns in forty-seven OSCC specimens. The EBV gene expression patterns in the OSCC tissues were presented by colored codes, as pink, red, blue, green, and yellow squares represented log numbers in the respective ranges of 5.9–5.0, 4.9–4.0, 3.9–3.0, 2.9–2.0, 1.9–1.0, and < 0, with larger numbers denoting greater expression levels. Among the 47 tissue specimens, the total numbers of samples that expressed the particular viral genes were counted and listed on the left (No. exp. in tissues).

